Number Theory: How rich are India’s richest – and how poor are the rest?
The scourge of wealth inequality is a global phenomenon. Perhaps what distinguishes India, if only slightly, is that most of its population is basically very poor; few would even make the world’s middle class. Yet, a few Indians rival the richest on the planet.
Not much is known about changes in the consumption and wealth distribution in India after 2012. The Indian government binned the last round of the consumer expenditure survey (for 2017-18), earlier rounds of which were widely used to measure poverty and inequality outcomes.
Recently released official sample surveys on household assets and liabilities allow us track changes in the distribution of household wealth. India’s National Statistical Office (NSO) produces a decennial wealth survey of households — the All-India Debt and Investment Survey (AIDIS) — which is nationally representative and detailed. Surprisingly, the latest edition of this data came earlier than expected, giving us a picture of Indian wealth in 2018 (thus, pre-pandemic).
In a recently released working paper “The sky and the stratosphere: concentrated wealth in India during the lost decade”, we studied the changes in the household wealth distribution between 2012 and 2018.
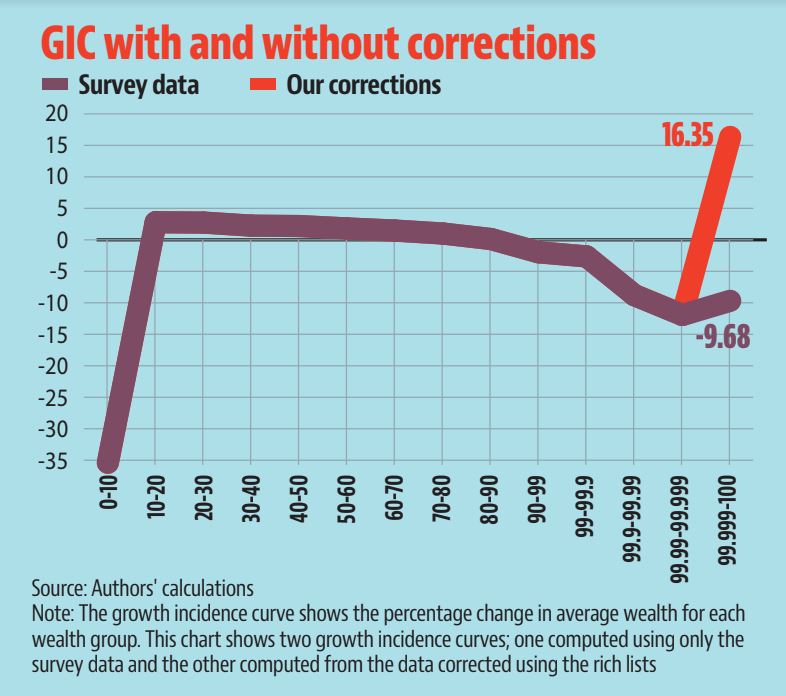
The results of our analysis were surprising. We found a decline in wealth inequality, driven by inflation adjusted losses for the richest 10%. If true, this would reverse much of the increase in inequality since the early 1990s (the liberalisation period).
We show this using the Gini coefficient, a popular index of inequality. The Gini coefficient ranges from zero to one; values closer to zero indicate lower levels of inequality, and values closer to one indicate higher levels of disparity.
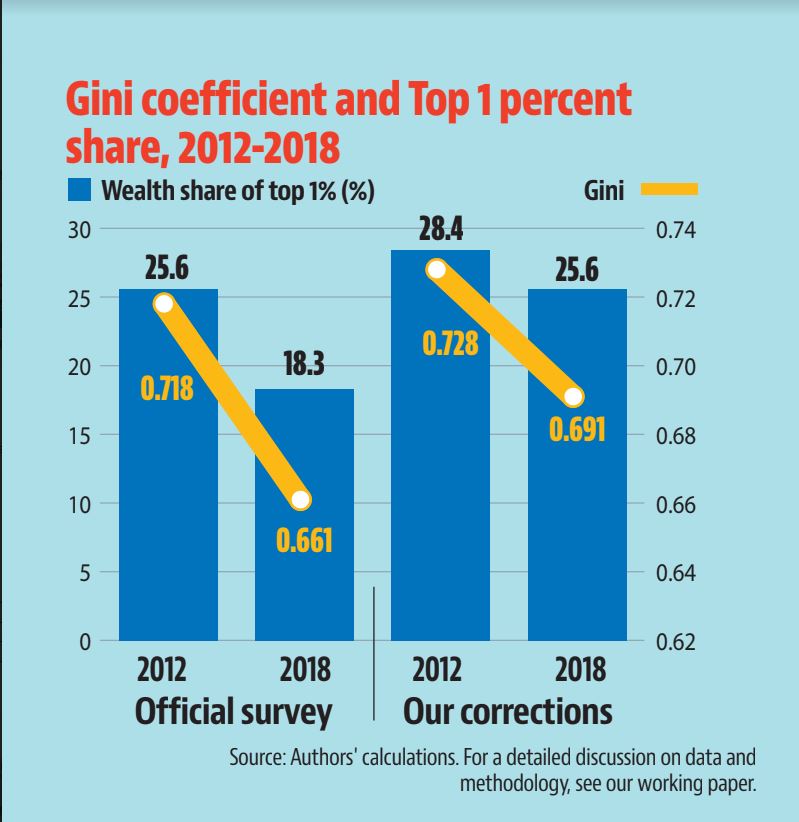
Official data suggests that the Gini coefficient of per adult household wealth in India fell from 0.718 in 2012 to 0.661 in 2018. The share of wealth of the top 1% – another indicator of wealth concentration – also declined from 26% in 2012 to 18% in 2018.
In fact, because wealth is highly concentrated, a decline at the top has implications for average wealth; survey data suggests the per-capita wealth in India decreased during this period.

These results are surprising because there was no top-down redistributive policy in place between 2012 and 2018. In fact, the wealth tax, after being defunct for decades, was officially abolished in 2015.
The biggest puzzle is that the vast majority of Indians hold their wealth in precious metals (gold, silver) whose prices have declined in real terms. The wealth of the richest families moved in tandem with stock markets, which performed reasonably well between 2012 and 2018.

A closer scrutiny of the data suggests that official surveys miss the actual rich: the sample surveys estimated the wealth of the richest Indian in 2018 at ₹24.4 crore. According to publicly available wealth rankings, however, India’s richest person, Mukesh Ambani, was worth over ₹250,000 crore in 2018! This difference is many orders of magnitude larger, and ignoring the actual rich creates an illusion about the true wealth distribution.
To account for the rich, we recreated the distribution by appending the rich using widely published wealth rankings. The results from our novel data set mitigate the degree of decline, but most importantly also show a remarkable increase in the wealth of the super rich.

The share of the richest 0.001% in total wealth was only about 0.34% in 2018 as per the official survey data. Our results show that the richest 0.001% own over 9% of the total wealth in 2018. We find that the wealth share of the 0.001% doubled between 2012 and 2018. By 2018, the richest 7,000 adults in India owned more wealth than the bottom 350 million people.
How rich are India’s wealthy in comparison to other countries? We find that India’s top 0.001% have a higher wealth share than their counterparts in other major economies such as China and the US. In fact, India is second only to Russia in the wealth share of its super rich, an ominous development considering the well-known oligarchic control in that country.

Our findings have several implications. Firstly, it appears that official surveys are unable to keep up with the actual rise in wealth at the top. This is an important mark of how the rich have disconnected from the sky (the limit of survey methodology) and gone into the stratosphere. To understand wealth inequality, it’s imperative to account for elite wealth — the few whose wealth is astronomical in a country where most people have little (if any) wealth.
Secondly, it is high time inequality became central to the public policy discourse. For decades, India’s policy makers have focused on the lower end of the income distribution and poverty has been the focal point of debates, while ignoring the wealth concentration at the top.
It is abundantly clear that burgeoning inequality cannot be ignored anymore. It is coming in the way of efforts to reduce poverty, address climate change, and sustain a genuine representative democracy.
(Rishabh Kumar and Ishan Anand teach at University of Massachusetts Boston and OP Jindal Global University, respectively.)
For all the latest business News Click Here

