Data | Parsing the inflation story of the past year

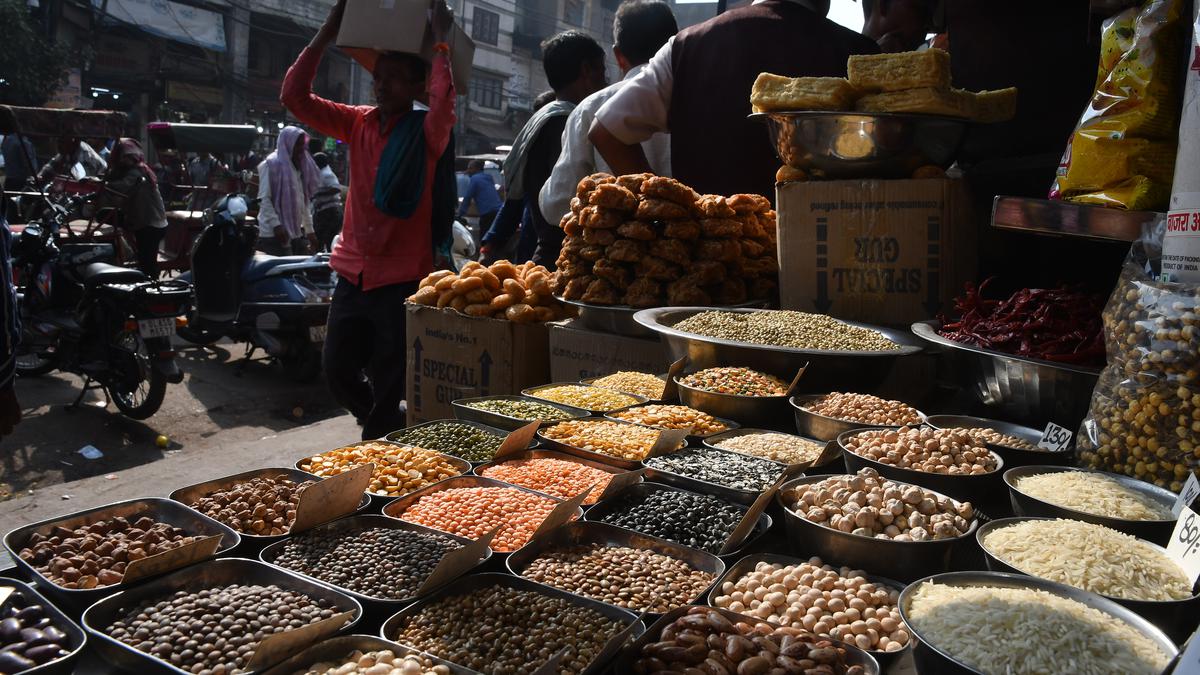
Inflation: Pulses put on display for sale at wholesale grocery market Khari Baoli, Delhi
| Photo Credit: Sushil Kumar Verma
The latest annual report released by the RBI highlights the factors and disruptors that heightened inflation levels worldwide. It also identifies the specific commodities that affected inflation across different components, like food, fuel and core inflation.
In 2022, global inflation reached its highest levels in decades in both advanced economies and emerging markets. This acceleration was largely attributed to the significant increase in food and energy prices caused by disruptions in the supply chain after the war in Ukraine.
International food prices have decreased since the May 2022 peak, owing to improved conditions in the supply of edible oils and grains. Yet, it remained higher than what it was before the war as trade restrictions and adverse weather conditions continue to impact food production in major producer-countries.
The changes in global commodity prices resulted in a surge in consumer price inflation in advanced economies (AEs) and emerging market and developing economies (EMDEs), prompting monetary policy tightening throughout the year.
Chart 1 | The chart shows the inflation in various countries/regions in the last six years.
During the 2022-23 period, India faced a significant increase in inflation. Retail inflation remained above the upper limit of the inflation target for several months between January and October 2022. In April 2022, inflation peaked at 7.8%, driven by a sharp increase in three major categories: food, fuel, and core inflation (excluding food and fuel). This rise was the result of the disruption in supply, higher global commodity prices, and currency depreciation.
When the supply chain pressures finally normalised and input costs eased due to a decline in global commodity prices, inflationary pressures also lessened. However, it surged once again in the first two months of 2023 due to an unexpected increase in cereal prices which then moderated in March 2023.
Chart 2|The chart shows the inflation of various major components in India across the years.
Charts appear incomplete? Click to remove AMP mode
Inflation in the food and beverages category, which accounts for 45.9% of retail inflation, fluctuated between 4.6% and 8.4%, due to surges in costs of global food and fertilizer, heatwaves, rising costs of farming inputs, and seasonal price patterns.
In the first half of the year, India experienced an acceleration in food inflation, influenced by higher prices of vegetables, animal proteins, cereals, and related products. However, by the second half, inflation moderated.
Chart 3 | The chart shows the inflation across major food sub-groups.
Click to subscribe to our Data newsletter
Food and beverages inflation averaged 6.7% during this period compared with 4.2% in the previous year, with an increase in five sub-groups (Chart 3). Food inflation did, however, decrease in the remaining seven sub-groups.
Fuel inflation remained in double digits for the major part of the year due to high domestic LPG and kerosene prices, in line with internal prices. However, the inflation moderated as the global crude oil prices cooled. Inflation excluding volatile food and fuel, or the core inflation, showed a slight uptick to an average of 6.1% in 2022-23 – a marginal increase from 2021-22. It reached a peak of 7.1% in April 2022 and remained around 6% from May 2022. Inflation in the transport and communication sector gradually decreased after a sharp increase in the first quarter of 2022-23.
Chart 4 | The chart shows the drivers of retail inflation excluding food and fuel.
Chart 4 shows a widespread increase in core prices, with over 70% of items experiencing rates higher than 4% in 2022-23. Clothing and footwear inflation increased significantly, averaging 9.5% during this period.
Source: Annual Report 2022-23 released by Reserve Bank of India
Also read | Optical relief: On headline inflation
Watch our data point video:Data Point: Antarctica’s summer ice cover hits record low
For all the latest business News Click Here

